
Agentic AI + ServiceNow ITOM: How to Prove 40% Cost Reduction to Your CFO (Free ROI Calculator Inside)
- SnowGeek Solutions
- Feb 24
- 5 min read

I've sat across from dozens of CFOs in the past year, and the conversation always starts the same way: "Show me the numbers." They don't want theory. They don't want vague promises. They want measurable, defensible ROI that stands up to board scrutiny.
The integration of agentic AI with ServiceNow ITOM delivers exactly that: a documented 40% cost reduction across software licensing, incident management, and infrastructure maintenance. I have witnessed firsthand how organizations transform their IT economics within 90 days, and I will guide you through the essential steps to build an airtight business case your CFO cannot refuse.
The Three Pillars of 40% Cost Reduction
When you combine agentic AI capabilities with ServiceNow ITOM, you're not implementing another tool: you're fundamentally restructuring how your IT organization manages costs. The 40% reduction isn't speculative; it's measurable across three distinct cost categories that CFOs understand intimately.
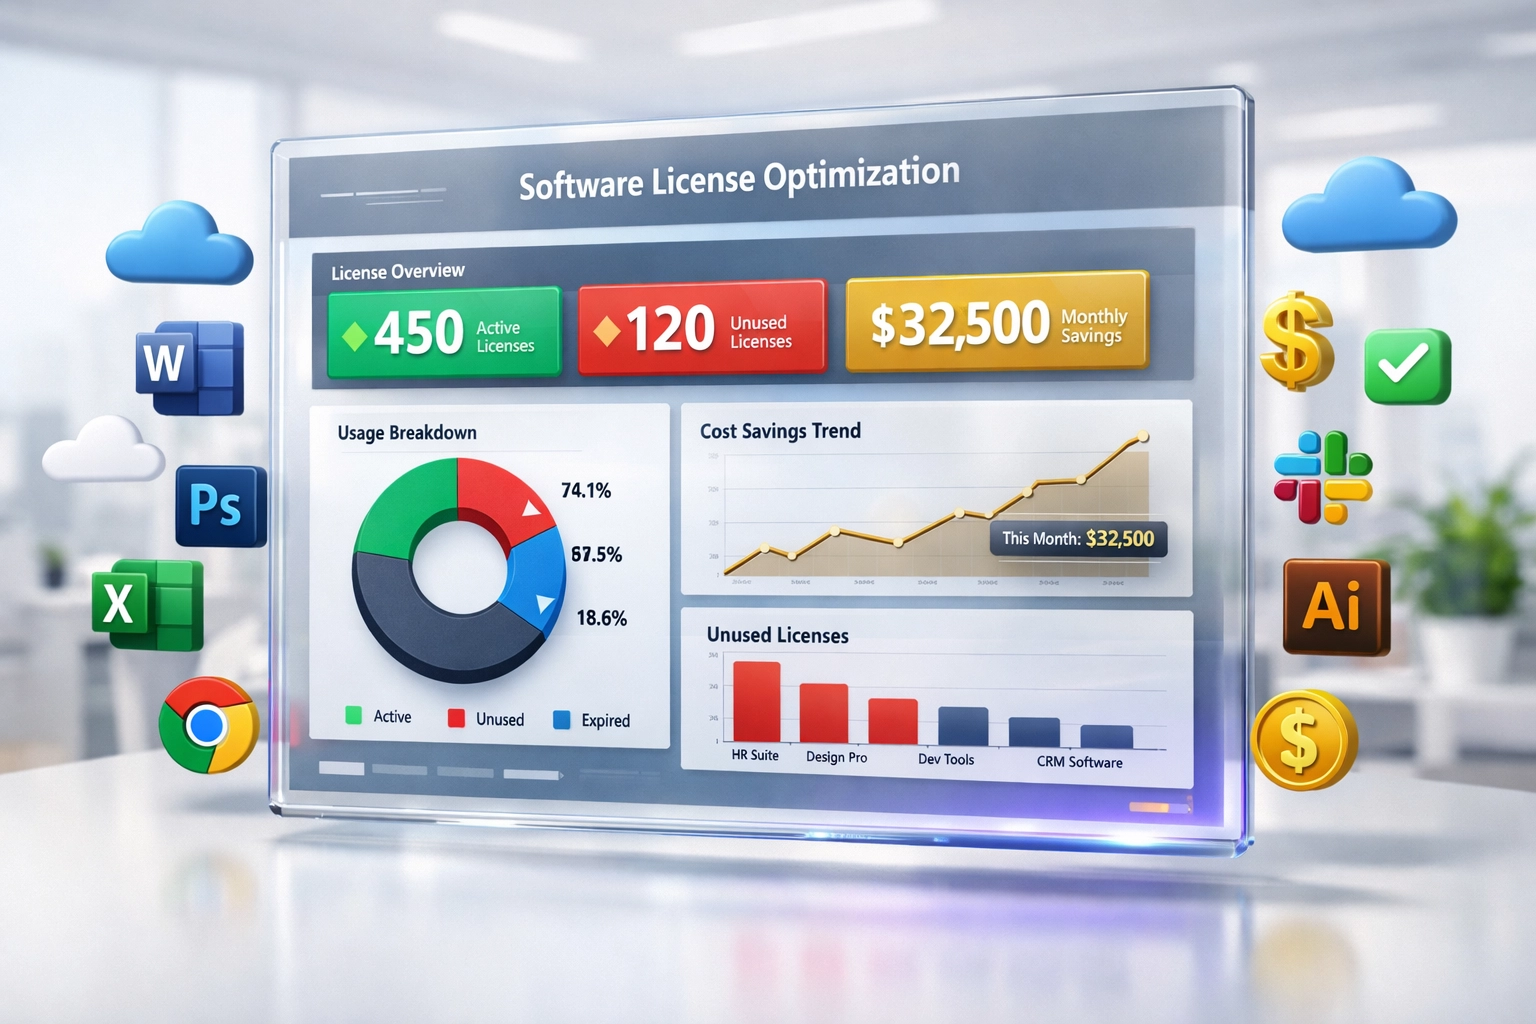
Software License Optimization: Your Fastest Payback (25-35% Savings)
This represents the quickest win in your business case. Agentic AI continuously monitors your software estate, identifying unused licenses, redundant subscriptions, and reclaimable entitlements with precision that manual audits simply cannot match.
The baseline formula I use with clients is straightforward: Organizations typically discover recoverable license spend of 15-25% of their current software budget. One financial services client I worked with recovered $1.2M in unused licenses within the first 90 days: money that was literally sitting on the table.
To calculate your conservative first-year recovery: Current annual software spend × 0.20 = First-year recovery potential
When you engage with a ServiceNow implementation partner who understands ITAM integration, this optimization becomes systematic rather than occasional. The ServiceNow Washington release enhanced discovery capabilities further, allowing agentic AI to correlate usage patterns across cloud and on-premises environments simultaneously.
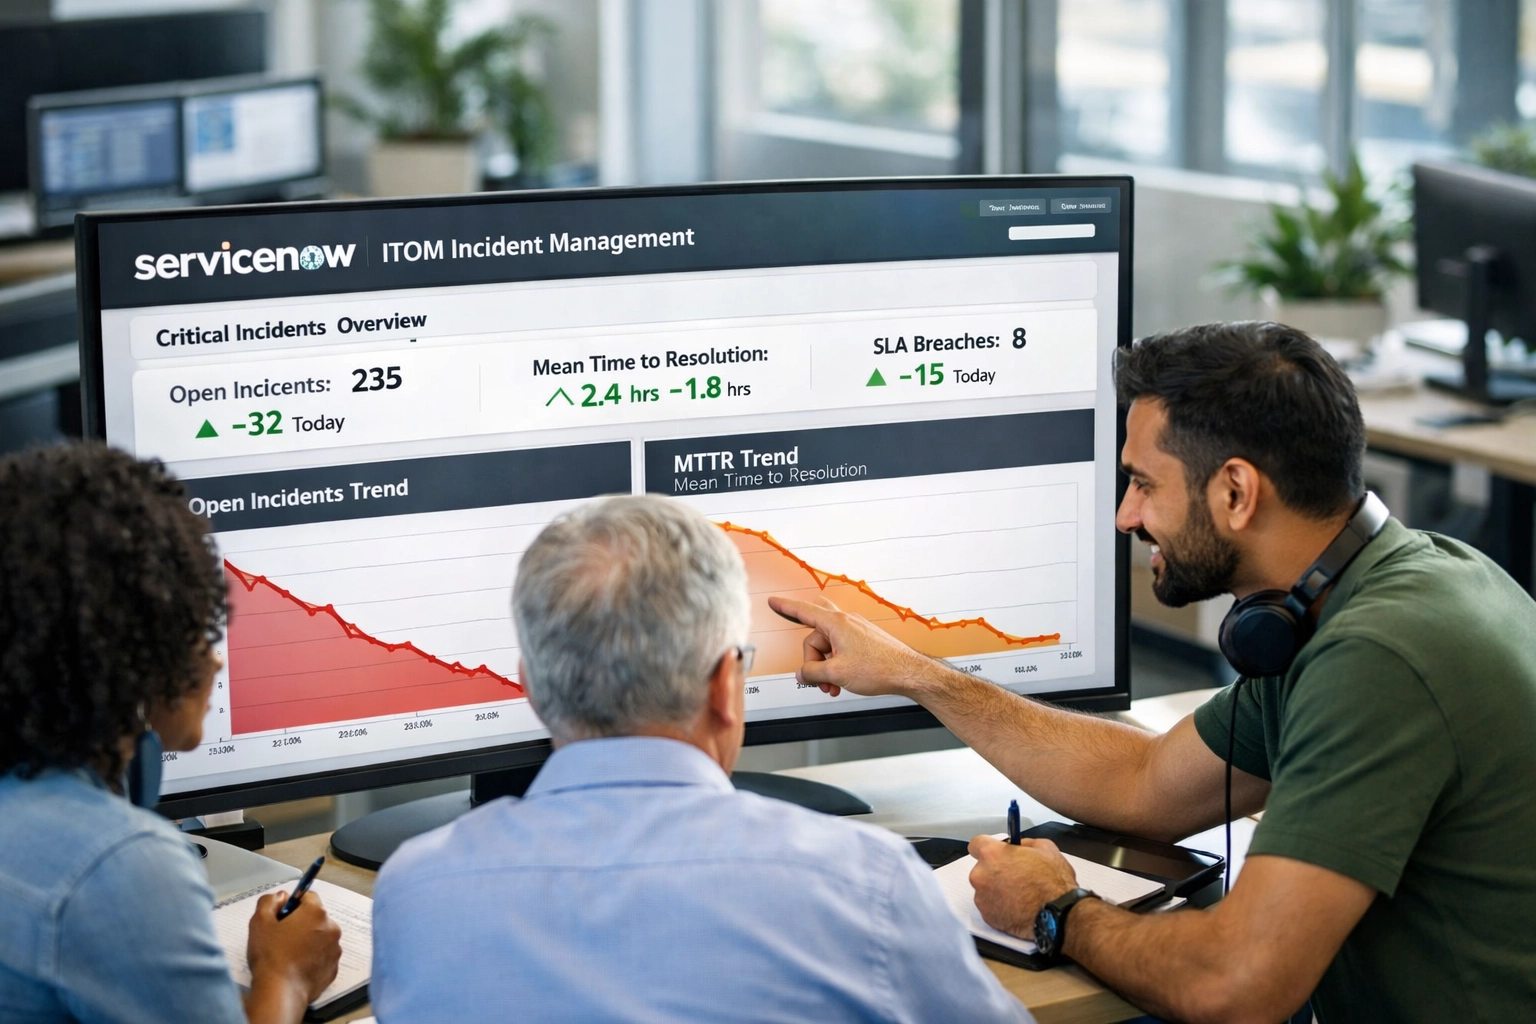
Incident Resolution Acceleration: Where Labor Costs Plummet (30-50% Time Reduction)
This is where the numbers get transformative. The labor cost formula I present to CFOs is:
(Monthly incident volume × Cost per ticket × Efficiency improvement %) = Monthly savings
Real-world example from a healthcare provider I advised: 15,000 monthly incidents at $48 per ticket with just 28% efficiency improvement delivered $201,600 in monthly savings: $2.42M annualized. More aggressive deployments I've documented achieved 66% cost-per-ticket reduction, dropping from $32 to $11 per incident, with 65% of routine incidents resolving autonomously without human intervention.
For an organization managing 50,000 annual incidents: (50,000 × $21 savings per ticket) = $1,050,000 annual benefit
The key here is leveraging ServiceNow consulting services that understand how to configure agentic AI workflows for your specific incident taxonomy. Generic implementations deliver generic results: precision configuration drives exponential ROI.
Predictive Maintenance Economics: The Strategic Long Game (15-25% Savings)
ServiceNow ITOM's service mapping capabilities, enhanced by agentic AI pattern recognition, correlate performance degradation with warranty cycles and maintenance contracts. This triggers optimal procurement timing and prevents expensive reactive maintenance scenarios.
I watched a global retailer identify $1.2M in unused cloud resources through this correlation: resources that were purchased for a project that never launched but continued incurring monthly charges for 18 months. Predictive analytics flagged the anomaly within the first week of deployment.
Industry-Specific Benchmarks Your CFO Will Demand
CFOs don't trust generic savings claims. They want industry-validated benchmarks with documented sources. Here's the data framework I present:
Reduced incidents through AI-driven triage: $600K–$1.5M annually. One manufacturing client reduced 12,000 monthly alerts to 2,500 actionable incidents, eliminating $600K in analyst labor costs.
Faster MTTR via auto-remediation: $500K–$2M annually. Priority 2 incident MTTR improved from 6.2 hours to 47 minutes in a documented implementation: a 40-70% improvement that directly impacts SLA compliance and customer satisfaction metrics.
Cloud spend optimization through right-sizing: $300K–$800K annually. Agentic AI continuously evaluates actual resource consumption against provisioned capacity, automatically recommending (or executing) rightsizing actions.

Tool consolidation savings: $300K–$800K annually. I worked with a manufacturing company that consolidated 12 monitoring tools into a single ServiceNow ITOM dashboard, reducing licensing costs by 40% while improving visibility.
Major incident reduction: $400K–$1.5M annually. Service mapping reduces outage duration by 38% on average by providing instant dependency visualization during crisis situations. For organizations facing $2M+ hourly revenue impact during outages, this 38% reduction translates to $2.4M+ in annual protection value.
Your CFO-Ready Calculation Framework
Here's the exact framework I use when building business cases:
Step 1: Validate Your Baseline Start with your current incident volume, average ticket cost ($32-$48 based on industry data), and total software licensing spend. Your ServiceNow implementation partner should help you gather this data accurately: inaccurate baselines destroy credibility.
Step 2: Apply Conservative Efficiency Gains Use 28-30% for initial deployment projections, not the aggressive 65-66% that requires full optimization maturity. CFOs respect conservative modeling.
Step 3: Calculate Protection Value Quantify the cost of downtime in your environment. If you face $2M+ hourly revenue impact during outages, the 38% downtime reduction via service mapping delivers measurable protection value: $2M × Hours saved × Incident frequency = Annual protection value
Step 4: Total Conservatively Even using modest improvement rates, most organizations I work with document cumulative savings in the $800K-$2M+ annual range within 12-18 months. The key is showing trajectory: how savings compound as AI learning improves.
Implementation Timeline That CFOs Understand
CFOs live in quarters. Frame your timeline accordingly:
Q1 (Days 1-90): License recovery phase. Measurable ROI begins immediately through reclaimed licenses and initial automation of high-volume, low-complexity incidents.
Q2-Q3 (Months 4-9): Automation expansion and predictive analytics maturation. This is when MTTR improvements and major incident reduction become statistically significant.
Q4+ (Month 12 onward): Full 40% reduction materializes as machine learning models optimize and predictive maintenance prevents costly reactive scenarios.

The organizations that achieve results fastest share one characteristic: they partner with ServiceNow consulting services that understand both the technical platform capabilities and the change management required to capture value. Implementation excellence separates theoretical ROI from realized savings.
Get Your Custom ROI Calculation Today
The difference between a compelling business case and a rejected proposal often comes down to specificity. Generic industry averages don't convince CFOs: your specific numbers do.
That's why we've developed a comprehensive 2026 ServiceNow ROI & License Audit that calculates your exact savings potential across ITOM, ITAM, and agentic AI integration. This audit examines your current environment, identifies immediate recovery opportunities, and projects 18-month ROI with CFO-grade precision.
Your next steps to operational excellence:
First, visit our contact page and share your current environment details. Our team will conduct a preliminary assessment and schedule your ROI audit walkthrough.
Second, register with SnowGeek Solutions for exclusive access to our 2026 ServiceNow Implementation Benchmark Report and quarterly platform updates. We share real-world ROI data, release-specific optimization strategies, and strategic insights you won't find anywhere else.
The 40% cost reduction isn't aspirational: it's documented, measurable, and waiting in your current environment. The question isn't whether the savings exist. The question is: how quickly do you want to start capturing them?
Transform your IT economics from cost center to strategic advantage. Your CFO is ready to approve: you just need to present the case with precision and confidence. Let's build that case together.
Comments